
I was catching up on Tangyslice’s blog and enjoying his 5 meaningless marketing metrics post, when I thought of another meaningless metric. Last week I was reading a presentation which described the response rate of one group as slightly greater than the control group. What does slightly greater mean in this context? Well, it turns out the difference was statistically significant once I did the math. What I find meaningless is when analysts do not look for statistical significance when comparing two groups. This is known as A/B Testing.
Conceptually A/B testing is very simple. You are comparing Group A to Group B. A might be a control group and B the test group. Alternatively, A and B might be two different offers, landing pages, e-mails, direct mail lists, or landing pages. As the name suggests, this is a test which is why A/B testing is also known as split testing. Ultimately, you want to know if A and B differ in a way that is statistically significant.
Here’s an example to make it concrete. Let’s say that you marketed to 50,000 customers encouraging them to purchase product A and 5,000 of them responded. That is a 10% response rate. In addition, there were 5,000 customers that you could have marketed to but that you did not. Instead, you assigned them to the control group. They look and act just like the 50,000 customers that you mailed. The reason for the control group is that some customers might buy product A regardless of whether you market to them or not. In this example, 450 of them or 9% purchased the product. Is the difference between 10% and 9% statistically significant? Was the campaign successful?
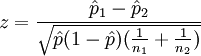
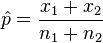
In this case, we perform the two-proportion z-test for equal variances using the following formula:
 and
and
where…
p1=10% (response rate for Group A)
p2=9% (response rate for Group B)
x1=5,000 (number of responders in Group A)
X2=450 (number of responders in Group B)
n1=50,000 (quantity mailed in Group A)
n2=5,000 (quantity mailed in Group B)
If the value of z is greater than 1.96 then the difference is significant at 95% confidence. In this case, the z value is 2.26 so the difference is statistically significant.
In order for the test to be valid a few assumptions must be met:
1. Your control group needs to contain customers or prospects that look and behave like the treatment group
2. You need to have sufficient numbers of direct mail recipients and responders such that n1 p1 > 5 AND n1(1 − p1) > 5 and n2 p2 > 5 and n2(1 − p2) > 5 and n2>29 and the groups contain independent observations
The math might look scary but really the hard part is making sure that the test is done properly. It is vital that the control contains a random selection of customers who are similar to the treatment group. If not, you could end up with very strange results